



Why a Lower STC Often Delivers Better Real-World Speech Privacy Than a Higher One
In commercial architecture, an acoustic test certificate is too often treated like a rubber stamp. A sales rep drops a binder on an architect’s desk, points to a bold number on the cover—say, STC 52 over an STC 50—and says, “Buy this one, it stops more sound.”
The architect writes it into the spec, the contractor buys it, and six months later the building owner calls complaining that private meetings in the boardroom can be heard word-for-word next door. The owner blames the partition, the contractor waves the lab certificate, and nobody understands what went wrong.
The problem is simple: looking only at the single-number STC rating tells you almost nothing about how that wall will actually perform when people start talking. The STC number is heavily skewed toward low-frequency bass rumble, not human speech. To know whether a partition will actually deliver privacy, you have to ignore the sales pitch, open the report, and look directly at the graph.
Understanding the Graph: What the Axes Mean
An ASTM E90 test graph plots raw acoustic performance across sixteen distinct sound pitches. Reading it is straightforward once you understand the two axes:
- The Horizontal Axis (Frequency / Pitch): Plotted along the bottom, this shows sound pitch in Hertz (Hz), running from deep bass on the left (125 Hz) to shrill, high-pitched tones on the right (4,000 Hz). Human vocal conversation sits squarely in the middle and upper-middle frequencies, from 500 Hz to 4,000 Hz.
- The Vertical Axis (Sound Blocked / Decibels): Plotted up the side, this measures Transmission Loss in decibels (dB)—meaning how many decibels of sound the wall physically stops. The higher the line is on the graph, the more sound the wall blocks.
A pre-shaped standard reference contour curve is laid over these test points. If a wall has a deep dip at even a single frequency, the entire official rating is penalized. Conversely, a wall can pack on heavy raw steel mass to block deep bass at 125 Hz, earn an official STC 52, yet fail miserably where people talk.
The Sound Test Graph: Sample Comparative Analysis
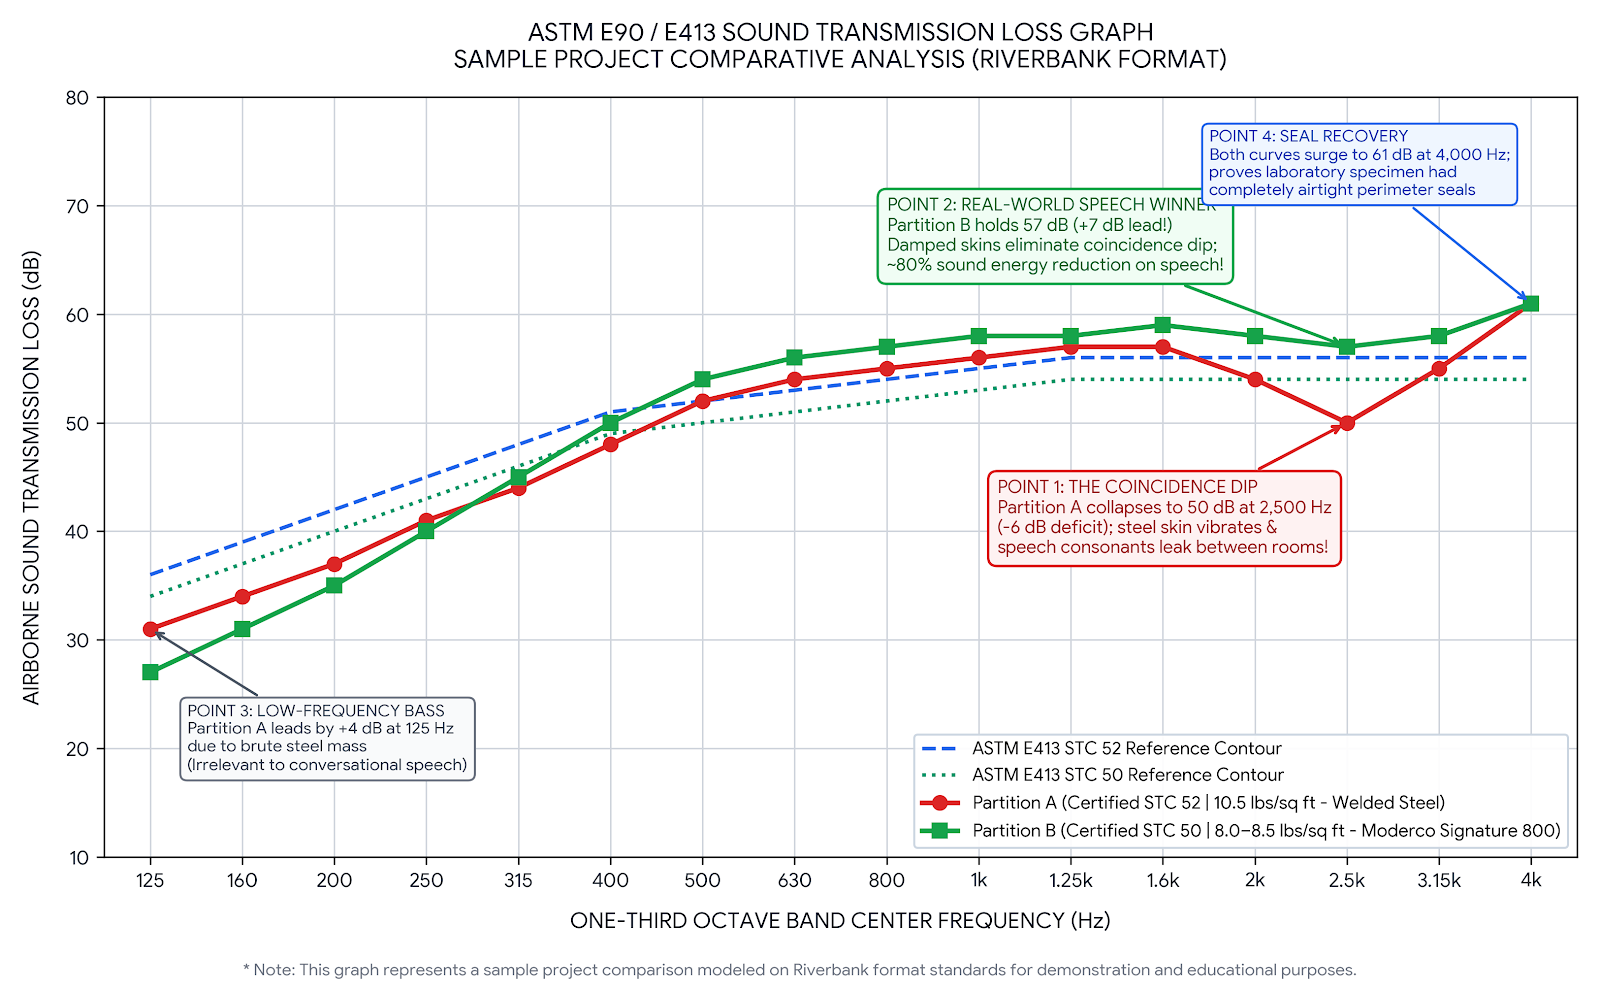
Below is a sample project comparison plotted in standard Riverbank format. It compares a heavy roll-formed steel panel (Partition A at 11 lbs./sq. ft., rated STC 52) against an engineered structural aluminum composite panel with damped skins (Partition B at 8.5 to 9.5 lbs./sq. ft., rated STC 50):
The Three Critical Spots on the Graph
When reviewing any manufacturer’s laboratory graph, look directly at these three areas:
- Spot 1: The Coincidence Dip at 2,500 Hz (Where Speech Privacy Is Won or Lost) —
Look at the red line for Partition A around 2,500 Hz. Notice that sudden downward collapse to 50 dB? That is the “coincidence dip.” It happens when the airborne sound wave matches the natural bending stiffness of the steel panel face. The steel sheet resonates like a speaker cone, broadcasting sound straight through. Because over 80% of human speech comprehension depends on vocal consonants (s, f, th, p, t) living between 1,500 Hz and 4,000 Hz, this dip destroys speech privacy. Partition B (the green line) uses damped composite skins that do not ring, holding strong at 57 dB—a massive 7 dB lead. In acoustics, 7 dB represents an approximate 80% reduction in transmitted sound energy!
- Spot 2: Low-Frequency Bass at 125 Hz (Heavy Weight vs. Speech Reality) —
On the far left Partition A blocks 31 dB at 125 Hz, while Partition B blocks 27 dB. Partition A earned those extra 4 decibels strictly from brute steel weight (10.5 lbs./sq. ft. vs. 8.0–8.5 lbs./sq. ft.). That extra bass blocking is what pushed Partition A’s official catalog rating to STC 52. But unless you are building a wall next to a mechanical boiler room or a nightclub subwoofer, deep 125 Hz rumble has nothing to do with meeting room confidentiality.
- Spot 3: Seal Recovery at 4,000 Hz (Verifying Perimeter Seals) —
On the far right at 4,000 Hz, both curves surge to 61 dB. High-frequency waves are tiny (under 3 inches). If mechanical floor seals or vertical panel joints have even a pinhole air leak, high-frequency sound pours through and the curve crashes. Seeing both curves climb above 60 dB confirms that the lab specimen was sealed completely airtight during testing.
Matching the Graph to Your Project Needs
Instead of demanding “the highest STC number,” architects and facility planners should look at the frequency zone that matches their actual space:
- Corporate Boardrooms & Private Offices: Focus on 1,500 Hz to 4,000 Hz (The Consonant Range). If a wall takes a coincidence dip at 2,000 or 2,500 Hz, confidential HR discussions, legal depositions, and financial reviews will leak. You want a flat, high curve across this vocal range. A wall that stays at 57 dB here is vastly superior to a heavier wall that collapses to 50 dB.
- Schools & Classrooms: Focus on 500 Hz to 2,000 Hz (Vocal Projection & Activity). Teachers’ voices and children’s activity dominate the mid-range. You need strong, steady transmission loss across these middle frequencies so adjacent classes do not distract each other.
- Hotels & Convention Ballrooms: Look at Both Ends of the Curve. Ballrooms frequently host a loud banquet or DJ on one side and a corporate lecture on the other. You need strong speech blocking (1,500–3,150 Hz) for the meeting, combined with solid low-frequency isolation (125–250 Hz) to keep heavy bass music from thumping through.
- Churches & Community Halls: Focus on 250 Hz to 2,000 Hz (Choral & Acoustic Sound). Fellowship halls and multi-purpose rooms need balanced isolation across vocal and instrumental ranges without burdening church volunteers with massive, heavy steel panels that are difficult to move.
The Bottom Line: Look Past the Number
Here is the practical truth: in the vast majority of commercial applications, a properly engineered partition with a lower STC can perform significantly better at blocking sound than a partition with a higher STC.
Human beings communicate with vocal consonants, not subwoofers. When an STC 52 panel earns its rating by packing on heavy steel mass to block 125 Hz bass rumble, but collapses in a coincidence dip at 2,500 Hz, it will leak conversation every day. Meanwhile, an STC 50 panel built with composite-damped skins that eliminate that coincidence dip will stop 80% more speech energy where it actually counts—all while saving thousands of pounds of overhead deadweight.
Stop specifying operable walls by the catalog integer on the front cover. Open the test report, check that the lab tested a realistic 9′ × 14′ opening with the mandatory 5-cycle operational test, and read the graph across the speech frequencies. If the curve stays high at 2,000 and 2,500 Hz, that is the partition that will keep your client happy.